

For each core glass property, the recommended precision glass measurement methods are: thickness via white-light interferometry (SWLI) or spectral interferometry for non-contact work, with calibrated micrometers (resolution to 0.0001 in., approximately 2.5 µm) for contact verification; refractive index and dispersion via critical-angle refractometry for point measurements or spectral interferometry for simultaneous RI and thickness; density via hydrostatic (Archimedes) weighing to ±0.001 g·cm⁻³ or gas pycnometry (AccuPyc) for porous or small specimens; thermal properties and viscosity via dilatometry for CTE and matched viscometry techniques (parallel plate for log η 4–10, fibre elongation for log η 6–15, ball penetration for log η 8–12); optical transmission, absorbance and colour via UV-Vis spectrophotometry with CIE Lab* colour reporting; and surface flatness and homogeneity via Fizeau or laser interferometry with wavelength-tuning phase extraction. For mm-thick optical blanks, combining dual-scanning SWLI with Fizeau interferometry reduces dispersive errors to less than 60 nm. All measurements require calibration traceable to UKAS-accredited references and documented uncertainty budgets.
- Thickness (contact): micrometer ±2.5 µm, caliper ±25 µm
- Thickness (non-contact): SWLI/spectral interferometry, sub-micron to nanometre scale
- Refractive index: critical-angle refractometer ±0.0002; TIRDHM spatial mapping better than ±3×10⁻⁴
- Density: Archimedes hydrostatic ±0.001 g·cm⁻³; gas pycnometry for complex geometries
- Surface flatness: Fizeau interferometry, nanometre-scale fringe resolution
- Calibration: UKAS traceability required for all production-critical measurements
Key takeaways
Precision glass measurement requires matching the method to the property, the tolerance, and the production context, with UKAS-traceable calibration underpinning every result.
| Point | Details |
|---|---|
| Match method to tolerance | Use interferometry (sub-60 nm) for optical blanks; micrometers (±2.5 µm) for shop-floor dimensional checks. |
| Combine methods for critical parts | Spectral interferometry for thickness and RI together; Fizeau for surface form; hydrostatic weighing for density. |
| Control environment rigorously | Temperature variation of 0.1°C and floor vibration both degrade interferometric results to unacceptable levels. |
| Maintain UKAS traceability | Calibration certificates, in-house verification logs, and CRM references are required for audit-ready QA. |
| Document uncertainty budgets | Every production-critical measurement needs a written uncertainty budget covering all significant error contributors. |
Table of Contents
- Which glass properties are measured in industry and why they matter
- Thickness measurement: which method suits your application?
- Refractive index and dispersion: point measurement vs spatial mapping
- Density measurement: Archimedes, pycnometry and standards
- Thermal properties: dilatometry, softening points and viscosity across regimes
- Optical transmission, absorbance, haze and colour in production
- Surface flatness, figure and homogeneity: interferometric mapping
- Instrumentation, standards and traceability: selecting the right tools
- Practical measurement workflows: sample preparation, fixturing and troubleshooting
- Advanced methods and their measurable limits
- How we approach measurement in production at Precision Glasses
- Sources
Which glass properties are measured in industry and why they matter
Every glass component that leaves a production line carries a set of measurable properties that determine whether it will perform as specified in service. Understanding which properties to measure, and why, is the foundation of any credible QA programme.
- Thickness and geometric dimensions govern mechanical strength, optical path length, and fit within assemblies. A 10 µm deviation in a medical device window can shift focal length or compromise hermetic sealing.
- Refractive index and dispersion control image quality, wavefront error, and chromatic aberration in optical systems. For defence and aerospace optics, RI tolerances are typically specified to ±0.0005 or tighter.
- Density is a proxy for compositional homogeneity and a direct input to buoyancy calculations, weight budgets, and radiation-shielding assessments. ASTM C729 and C693 define the accepted test methods.
- Thermal properties (coefficient of thermal expansion, softening point, viscosity) determine whether a component survives thermal cycling, can be sealed to metals, or will deform during downstream processing. ISO 7884 and related standards govern viscosity reporting.
- Optical transmission, absorbance, haze and colour are critical for display glass, sensor windows, and lighting components. CIE Lab* coordinates and percentage transmission at specified wavelengths are the standard reporting format.
- Surface flatness, figure and homogeneity set the wavefront quality of optical windows and mirrors. Interferometric measurement in waves (λ) or nanometres is the accepted metric for precision optics.
- Hardness, surface roughness and coating integrity affect scratch resistance, adhesion of functional coatings, and long-term durability. Profilometry and nanoindentation are the primary tools.
Each of these properties connects to a specific ASTM or ISO standard, and traceability to UKAS-accredited calibration is expected for production-critical measurements. The quality standards in glass manufacturing framework published by Precision Glasses sets out how these requirements map to common industry certifications.
Thickness measurement: which method suits your application?
Thickness is the most frequently measured glass property in production, and the choice between contact and non-contact methods depends on tolerance, sample geometry, and throughput requirements.
Contact methods: micrometers and calipers
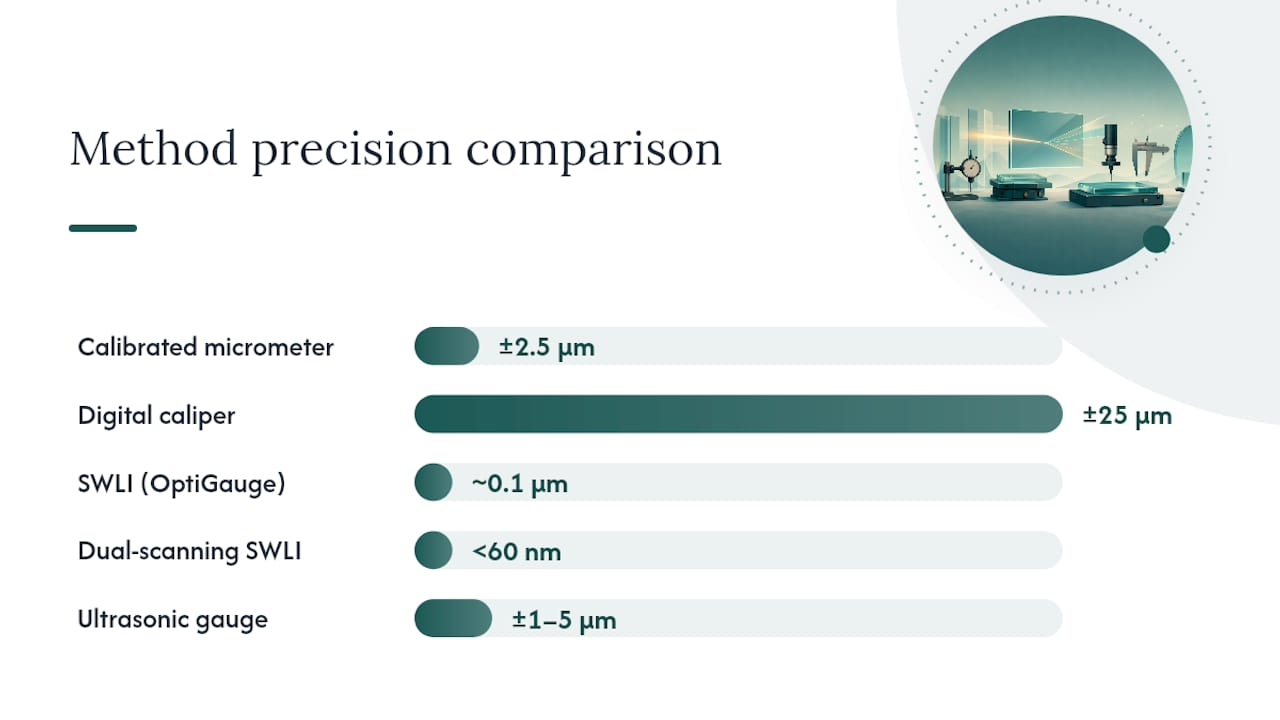
Calibrated micrometers from manufacturers such as Mitutoyo and Starrett remain the workhorses of shop-floor thickness checking. A skilled operator using a Mitutoyo micrometer can achieve resolution to 0.0001 in. (approximately 2.5 µm), while digital calipers typically resolve to 0.001 in. (25.4 µm). Contact force must be controlled carefully on glass: excessive anvil pressure introduces elastic deformation errors, and flat, parallel anvil faces are mandatory. Operator technique accounts for the largest share of repeatability variation in contact measurement, so fixturing and consistent seating practice are not optional extras.

Non-contact optical methods
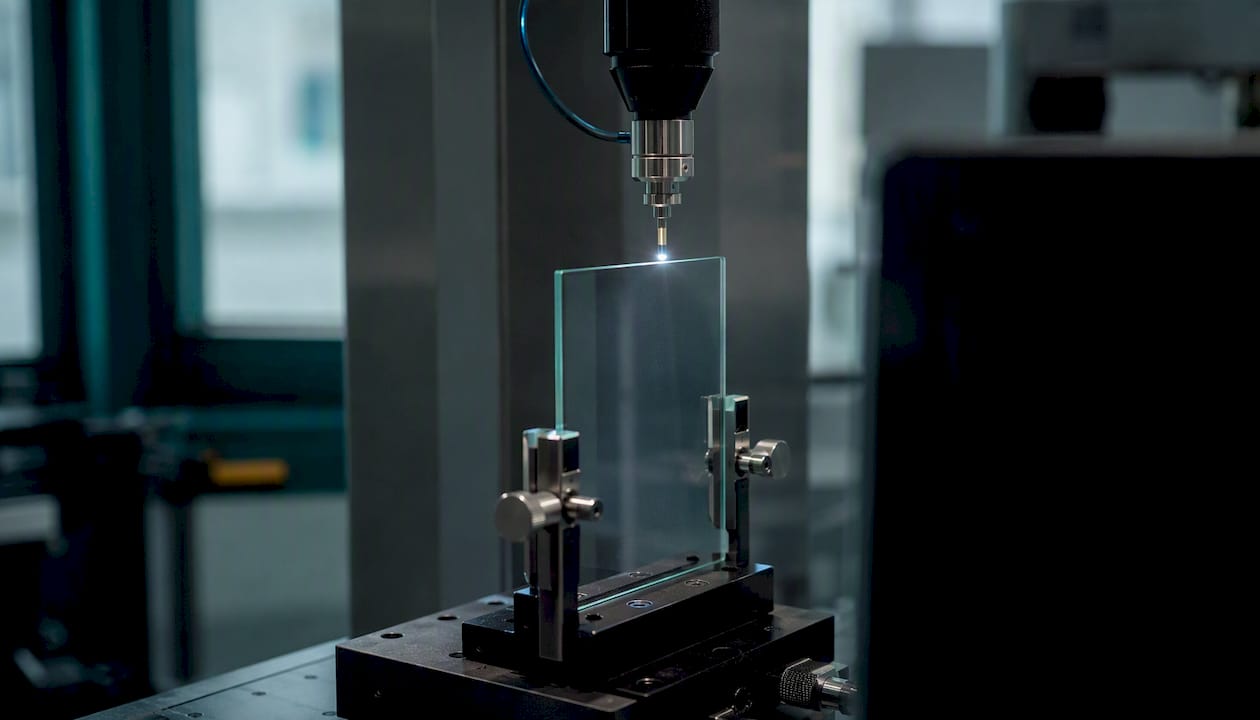
White-light interferometry (SWLI) is the standard non-contact technique for glass thickness below approximately 1 mm. All-fibre designs such as the Lumetrics OptiGauge remove free-space optics and moving mirrors, achieving approximately 0.1 µm accuracy across a wide range of glass shapes and sizes, and are well suited to in-process and offline inspection. For mm-thick optical blanks, dispersion within the glass becomes the dominant error term for conventional SWLI. A dual-scanning SWLI design that compensates for dispersion achieved measurement error below 60 nm on a 1 mm plate, a result that conventional single-scan instruments cannot match.
Spectral interferometry with Fourier-domain phase extraction measures both geometric thickness and refractive index simultaneously in a single non-contact scan. Comparative experiments show agreement with a high-precision coordinate measuring machine, making it a strong choice where both properties must be verified together. Laser triangulation and ultrasonic thickness gauges extend the range to thicker sections and curved surfaces, though at lower resolution than interferometric methods.
Method comparison
| Method category | Typical precision | Sample constraints | Environmental sensitivity | Throughput |
|---|---|---|---|---|
| Calibrated micrometer | ±2.5 µm | Flat, accessible surfaces | Low (temperature drift) | High |
| Digital caliper | ±25 µm | Flat or near-flat | Low | Very high |
| SWLI (fibre, e.g. OptiGauge) | ~0.1 µm | Up to ~1 mm thick; clear glass | Moderate (vibration) | Medium |
| Dual-scanning SWLI | <60 nm error on 1 mm | Flat plates, mm-scale thickness | High (vibration isolation required) | Low–medium |
| Spectral interferometry | Sub-micron, CMM-comparable | Clear, parallel surfaces | Moderate | Medium |
| Ultrasonic gauge | ±1–5 µm (material-dependent) | Any thickness; opaque or coated | Low | High |
Pro Tip: When measuring mm-thick optical blanks with SWLI, insert a dispersion-compensation plate matched to the glass type and thickness in the reference arm. This single step suppresses the dominant dispersive error and can reduce measurement uncertainty by an order of magnitude compared with an uncompensated scan.
For a detailed treatment of thickness tolerances and their functional consequences, the Precision Glasses guide on glass thickness for engineers provides application-specific tolerance bands.
Refractive index and dispersion: point measurement vs spatial mapping
Refractive index (RI) and its wavelength dependence (dispersion, expressed as Abbe number) are among the most tightly specified properties in optical glass procurement. The measurement approach you choose depends on whether you need a single-point value for incoming inspection or a spatial map for homogeneity verification.
Point measurement: critical-angle refractometry and ellipsometry
Critical-angle refractometers (Abbe and Pulfrich types) are the standard production tool for RI point measurement. They achieve typical precision of ±0.0002 in skilled hands, require only a small polished contact surface, and are straightforward to calibrate against certified reference liquids. Ellipsometers extend this to thin-film RI and thickness on coated surfaces, though sample preparation and model fitting add complexity.
- Critical-angle refractometer: ±0.0002 RI, single wavelength or multi-wavelength (dispersion)
- Ellipsometer: RI and film thickness on coatings; requires optical model fitting
- Both methods: sensitive to surface contamination and contact-liquid cleanliness
Spatial mapping: spectral interferometry and TIRDHM
Where homogeneity across a blank matters, point measurement is insufficient. Spectral interferometry with Fourier-domain phase extraction separates geometric thickness from RI in a single measurement, providing a spatial map of both quantities. Total internal reflection digital holographic microscopy (TIRDHM) goes further: pilot experiments on fused silica demonstrated spatial RI mapping accuracy better than ±3×10⁻⁴ compared with a commercial critical-angle refractometer, making it one of the most capable methods currently available for homogeneity assessment.
The trade-off is throughput and sample preparation. TIRDHM requires high-quality polished surfaces and a controlled optical environment; it is a laboratory technique rather than a production-line tool. Spectral interferometry is more amenable to semi-automated workflows and can be integrated into acceptance testing for optical blanks.
Calibration references for RI measurement should be traceable to certified glass standards (e.g. Schott reference glasses with certified RI values) and, where possible, to UKAS-accredited calibration laboratories. Contact-liquid purity and temperature control (typically ±0.1°C) are the two most common sources of systematic error in critical-angle refractometry.
Density measurement: Archimedes, pycnometry and standards
Glass density is measured routinely for compositional QC, radiation-shielding calculations, and process monitoring. Three methods cover the practical range of sample types and precision requirements.
Hydrostatic (Archimedes) weighing
Hydrostatic weighing is the reference method for solid glass specimens and is specified in ASTM C729. The procedure involves weighing the specimen in air and then fully submerged in distilled water, applying Archimedes’ principle to calculate density. When performed carefully, with temperature-corrected water density and a well-calibrated analytical balance, precision of ±0.001 g·cm⁻³ is achievable. Temperature control is critical: a 1°C error in water temperature introduces a density error of approximately 0.0002 g·cm⁻³, which is significant at this precision level.
- Weigh specimen in air on a calibrated analytical balance (resolution ≥0.1 mg)
- Suspend specimen fully submerged in distilled water at a known, stable temperature
- Apply temperature-corrected water density from certified tables
- Repeat minimum three times and report mean ± standard deviation
Gas pycnometry (AccuPyc)
The AccuPyc gas pycnometer (Micromeritics) uses helium displacement to measure true volume, from which density is calculated. It is particularly suited to porous, granular, or irregularly shaped specimens where hydrostatic weighing is impractical. Sample size is constrained by the cell volume (typically 1 cm³ to 135 cm³ depending on the model).
Sink-float and comparative methods
ASTM C693 describes the sink-float method, in which glass specimens are compared against reference liquids of known density. It is faster than hydrostatic weighing for large batches but less precise, typically ±0.002–0.005 g·cm⁻³. It is most useful for sorting or screening rather than absolute density determination.
Practical checklist for density measurement accuracy:
- Confirm water or liquid temperature to ±0.1°C before each measurement
- Inspect specimen for surface bubbles; remove with a fine brush or brief ultrasonic agitation
- Verify specimen homogeneity: inclusions or bubbles bias hydrostatic results significantly
- Calibrate balance with UKAS-traceable weights before each session
- Record ambient temperature and barometric pressure for air-buoyancy correction on high-precision work
Thermal properties: dilatometry, softening points and viscosity across regimes
Glass thermal behaviour spans many orders of magnitude in viscosity, from near-liquid at forming temperatures to near-rigid at room temperature. No single technique covers this entire range, so practitioners must combine methods matched to the target log η regime.
Dilatometry and CTE
A push-rod dilatometer measures linear thermal expansion as a function of temperature, from which the coefficient of thermal expansion (CTE) is derived. Sample preparation requires a parallel-sided rod, typically 25–50 mm long, with flat, perpendicular end faces. Uncertainty in CTE measurement is typically ±0.1×10⁻⁶ K⁻¹ for well-prepared specimens in a calibrated instrument. The strain point and annealing point are identified from the dilatometric curve as inflection features, providing direct process-control data for annealing schedules.
Viscosity measurement across log η regimes
Viscosity measurement methods must be matched to the target log η range. Parallel plate viscometry covers log η 4–10, fibre elongation covers log η 6–15, and ball penetration covers log η 8–12. For parallel-plate measurements, heating rates must be controlled between 1°C/min and 5°C/min to avoid devitrification (crystallisation), which would invalidate the sag-rate calculation entirely.
| Method | log η range | Typical sample form | Key operating parameters |
|---|---|---|---|
| Parallel plate | 4–10 | Disc or cylinder, 10–20 mm diameter | Heating rate 1–5°C/min; inert atmosphere for reactive glasses |
| Fibre elongation | 6–15 | Drawn fibre, 0.5–1 mm diameter | Constant load; temperature ramp 2–5°C/min |
| Ball penetration | 8–12 | Block or thick plate, >10 mm | Controlled load; specimen must be inclusion-free |
| Beam bending | 10–14 | Rectangular bar | Three-point loading; atmosphere control |
Softening point definitions
The Littleton softening point (log η ≈ 7.65) is measured by the elongation rate of a standard fibre under its own weight, per ASTM C338. The annealing point (log η ≈ 13) and strain point (log η ≈ 14.5) are determined by fibre elongation or beam-bending methods per ASTM C336 and C598 respectively. ISO 7884 parts 1–8 provide the international equivalents for all viscosity measurement methods.
Pro Tip: For ball-penetration viscosity tests, inspect the specimen optically before testing. Microscopic inclusions or bubbles cause anomalous sag rates that are indistinguishable from a genuine viscosity shift. Degassing the melt before casting test specimens eliminates the most common source of outlier results.
Optical transmission, absorbance, haze and colour in production
Optical performance is the defining property for display glass, sensor windows, and lighting components. Measurement must be traceable, reproducible, and sensitive enough to detect the small shifts that coatings and thin films introduce.
UV-Vis spectrophotometry
A double-beam UV-Vis spectrophotometer measures percentage transmission (%T) and absorbance (A) across the ultraviolet and visible spectrum, typically 190–900 nm. Baseline correction with an air reference and a matched reference beam is mandatory for accurate absorbance values below 0.01 A.
- Present specimens perpendicular to the beam (±0.5° tilt introduces cosine errors at high transmission)
- Use matched reference cells or a certified air-path baseline
- Record specimen temperature: transmission in some glasses shifts measurably with temperature
- Report wavelength range, bandwidth (slit width), and specimen thickness with every result
Haze and integrated sphere measurements
Haze is measured per ASTM D1003 using a hazemeter with an integrating sphere. The sphere captures both direct and scattered transmission, separating haze (wide-angle scatter) from clarity (narrow-angle scatter). For coated glass, the sphere geometry must be specified because different instrument designs give different haze values for the same specimen.
Colour measurement and CIE Lab*
Colour is reported in CIE Lab* coordinates derived from spectrophotometric transmission data and a specified illuminant (typically D65) and observer (2° or 10°). The ΔEab metric quantifies colour difference between a specimen and a reference, with ΔE < 1 generally considered imperceptible to the human eye. Coatings and thin films shift a and b* values significantly; measuring the uncoated substrate first and then the coated part isolates the coating contribution.
Measurement uncertainty contributors for optical transmission include beam geometry (aperture and divergence), stray light level, wavelength calibration accuracy, and specimen surface quality. A full uncertainty budget should address each of these for production-critical measurements.
Surface flatness, figure and homogeneity: interferometric mapping
Surface form and transmitted wavefront quality are the defining metrics for precision optical windows, mirrors, and substrates. Fizeau and laser interferometry are the standard tools, but mm-thick plates introduce phase-extraction challenges that require specific algorithmic approaches.
Fizeau and laser interferometry
A Fizeau interferometer compares the test surface against a high-quality reference flat, generating interference fringes whose deviation from straight, equally spaced lines represents surface error. Instruments from Zygo and Taylor Hobson are widely used in UK optical manufacturing for both surface form and transmitted wavefront testing. Surface form is reported in waves (λ) or nanometres peak-to-valley (PV) and root-mean-square (RMS); a λ/10 PV specification at 633 nm corresponds to 63 nm.
For transmitted wavefront testing of mm-thick plates, the glass itself introduces dispersive phase errors when a broadband or multi-wavelength source is used. Wavelength-tuning Fizeau interferometry with improved phase-extraction algorithms suppresses these dispersive and nonlinear phase errors, enabling nanometre-scale optical thickness homogeneity measurements on BK7 and similar materials.
Phase extraction and dispersive errors
Phase-extraction algorithms that meet specific sampling-condition criteria reduce harmonic elements and sidelobe artefacts in wavelength-scanning interferometry. The 21-sample algorithm described in the literature for Fizeau measurements on optical glass plates addresses the nonlinear phase-modulation errors that standard 5-sample or bucket algorithms cannot suppress. For production use, the choice of algorithm should be validated against a reference flat of known figure before committing to a measurement protocol.
- Use a reference flat with certified figure error (λ/20 PV or better) traceable to UKAS
- Stabilise the environment: temperature variation of 0.1°C across the aperture introduces fringe drift
- Allow the instrument and specimen to reach thermal equilibrium (minimum 30 minutes for large blanks)
- Apply multi-surface suppression or dual-scan methods when back-surface reflections contaminate the fringe pattern
Pro Tip: For Fizeau measurements on parallel-plate glass, tilt the specimen by 1–2 arcminutes relative to the reference flat. This separates the front- and back-surface fringe patterns in frequency space, allowing the front-surface contribution to be isolated in post-processing without physical masking.
Spatial mapping across large blanks requires stitched sub-aperture scans when the blank diameter exceeds the interferometer aperture. Reference the stitching to a common datum surface and verify the stitch boundaries with overlapping measurements to detect systematic tilt errors.
Instrumentation, standards and traceability: selecting the right tools
Instrument selection is a balance between the precision the tolerance demands, the throughput the production rate requires, and the maintainability the facility can sustain. Getting this balance wrong in either direction costs money: over-specified instruments are expensive and slow; under-specified instruments generate escapes.
Hand tools and shop instruments
Micrometers and calipers from Mitutoyo and Starrett are the standard entry point for dimensional QC on glass components. Modern electronic micrometers with IP67 protection and wireless data output connect directly to SPC software, reducing transcription errors and supporting shop-floor robustness. Height gauges and bore gauges extend the range to edge dimensions and internal features. All hand tools should be calibrated at defined intervals against UKAS-traceable gauge blocks, with calibration records maintained for audit.
Bench and laboratory instruments
For optical and surface measurements, interferometers from Zygo and Taylor Hobson represent the production standard in UK optical manufacturing. The Zygo Verifire and Taylor Hobson Talysurf series cover surface form from sub-nanometre roughness to millimetre-scale flatness. Gas pycnometers (AccuPyc, Micromeritics) handle density measurement for complex or porous specimens. UV-Vis spectrophotometers from manufacturers such as PerkinElmer and Shimadzu cover transmission and absorbance measurement across the UV and visible range.
Instrument class should be matched to the tightest tolerance on the drawing. A general rule: the measurement system’s combined uncertainty should not exceed one-tenth of the tolerance band (the 10:1 gauge ratio). For a flatness tolerance of λ/4 (158 nm at 633 nm), the interferometer’s combined uncertainty should be below approximately 16 nm.
Calibration, UKAS traceability and audit readiness
- Establish calibration intervals based on instrument stability data and usage frequency, not arbitrary annual cycles
- Maintain a calibration register with instrument ID, calibration date, due date, and reference to the UKAS-accredited laboratory certificate
- Use certified reference materials (CRMs) for RI, density, and transmission calibration where available
- Perform in-house verification checks (gauge block comparison, reference flat check) between formal calibrations to detect drift
- Retain calibration certificates and uncertainty statements for a minimum of five years for audit purposes
Standards governing glass measurement include ASTM C729 (density by hydrostatic weighing), ASTM C693 (density by sink-float), ASTM C338 (softening point), ASTM C336 (annealing and strain points), and ISO 7884 (viscosity). For UK manufacturers, UKAS accreditation provides the formal framework for demonstrating measurement traceability to national standards.
Pro Tip: When selecting between a high-accuracy bench instrument and a faster production gauge, calculate the cost of a measurement escape (rework, scrap, field failure) and compare it against the instrument cost differential. For safety-critical applications in defence or medical devices, the 10:1 gauge ratio is a minimum, not a target.
Practical measurement workflows: sample preparation, fixturing and troubleshooting
A well-designed measurement workflow eliminates the most common sources of error before the instrument is switched on. The following workflow applies to interferometric thickness and RI measurement on a mm-thick optical blank.
Step-by-step workflow: interferometric thickness and RI on an optical blank
- Preparation: Inspect the specimen for scratches, chips, and surface contamination under raking light. Clean with optical-grade isopropanol and lint-free wipes using a single-stroke technique; never circular-wipe optical surfaces.
- Anneal verification: Confirm the specimen has been annealed to remove residual stress; stress birefringence above approximately 5 nm/cm will introduce phase errors in transmitted wavefront measurements.
- Thermal equilibration: Place the specimen in the measurement environment for a minimum of 30 minutes. For large blanks (>100 mm diameter), allow 60 minutes.
- Fixturing: Mount in a kinematic three-point fixture with contact points at the edge, not the optical surface. Verify the specimen is seated without rocking.
- Alignment: Align the specimen normal to the measurement beam to within 0.5 arcminutes. Use the back-reflection null as the alignment reference.
- Acquisition: Capture a minimum of five independent measurements, repositioning the specimen between each. Record ambient temperature and humidity.
- Post-processing: Apply the appropriate phase-extraction algorithm (21-sample for wavelength-tuning Fizeau; Fourier-domain for spectral interferometry). Subtract the reference flat contribution.
- Verification: Compare the mean result against the drawing tolerance. If the result is within 20% of the tolerance limit, escalate to a higher-precision method or increase the number of measurements.
Sample preparation checks
- Remove edge chips and sharp corners with a fine chamfer before measurement; chips scatter light and cause fringe discontinuities
- Verify surface cleanliness under a 10× loupe before placing in the instrument
- For density measurement, inspect for bubbles and inclusions using transmitted light; reject specimens with visible inhomogeneities
Fixturing recommendations
- Use kinematic mounts (three-ball or three-V-groove) for repeatable datum references
- For probe-based contact systems, control probe angle to within 1° of normal to the surface
- Avoid clamping forces that induce stress birefringence; use gravity-loaded fixtures where possible
Troubleshooting checklist
- Vibration fringes: Isolate the interferometer on a pneumatic table; check that HVAC and nearby machinery are not transmitting vibration through the floor
- Inconsistent RI vs thickness results: Verify surface cleanliness and contact-liquid purity for refractometry; check for residual stress birefringence in interferometric methods
- Bubble-related density errors: Re-inspect the specimen and repeat hydrostatic weighing after ultrasonic agitation to dislodge surface bubbles
- Poor repeatability in contact measurement: Check anvil parallelism and cleanliness; verify operator technique with a gauge block reference
The Precision Glasses manufacturing workflow guide provides additional context on how measurement integrates with fabrication process control.
Advanced methods and their measurable limits
The highest-precision glass measurement methods are distinguished not just by their uncertainty figures but by the specific error mechanisms they address. Understanding these mechanisms is what separates a measurement that is merely precise from one that is demonstrably accurate.
Dual-scanning SWLI achieves its sub-60 nm result on a 1 mm plate by compensating for the dispersion that makes conventional SWLI inaccurate on thick glass. The compensation plate in the reference arm is matched to the specimen material, so the dispersive phase shift cancels in the interference signal rather than accumulating as error.
Wavelength-tuning Fizeau interferometry with a 21-sample phase-extraction algorithm addresses the nonlinear phase-modulation errors that arise when the tuning is not perfectly linear. Algorithms that meet the specific sampling-condition criteria described in the literature reduce harmonic elements and sidelobe artefacts, pushing uncertainty to the nanometre scale for optical thickness homogeneity on BK7 and similar materials.
TIRDHM demonstrated spatial RI mapping accuracy better than ±3×10⁻⁴ in pilot experiments on fused silica, but it remains a laboratory technique. The requirement for high-quality polished surfaces, a controlled optical environment, and significant post-processing time means it is not yet a production tool.
Pro Tip: When validating a new optical measurement method, always run a parallel measurement with a traceable reference instrument, such as a high-precision CMM or a certified reference flat, before committing to the method for production acceptance. Spectral interferometry has shown CMM-comparable accuracy in verification tests, but that agreement must be demonstrated on your specific glass type and thickness range, not assumed.
Limitations that affect all advanced interferometric methods include: multiple reflections from parallel surfaces (ghost fringes), phase-extraction nonlinearities at low fringe contrast, environmental noise (thermal gradients, air turbulence), and coating-induced phase shifts. A complete uncertainty budget must account for each of these, not just the instrument’s stated resolution.
For coated or laminated glass, the measurement challenge increases substantially. Coatings alter the effective optical path length and introduce additional reflective interfaces. Spectral interferometry can resolve individual layer contributions in some cases, but the model complexity increases with the number of layers. For laminated safety glass, ultrasonic methods are often more practical than optical interferometry for total thickness measurement.
How we approach measurement in production at Precision Glasses
Method selection on a production line is never purely a technical decision. Throughput, operator skill, sample fragility, and the cost of a measurement escape all weigh against the theoretical precision of the instrument.
At Precision Glasses, we match the measurement method to the tightest tolerance on the drawing and the production volume. For high-volume display glass and sensor windows, calibrated electronic micrometers with wireless SPC output handle dimensional checks at the speed the line demands. For optical blanks destined for defence or aerospace applications, we combine spectral interferometry for thickness and RI with Fizeau interferometry for surface form, giving us a complete characterisation of the optical blank before it enters final polishing. This combined workflow has allowed us to identify process drift at the blank stage, well before it would manifest as a finished-part rejection.
Calibration is not a background activity for us. Every measurement instrument is on a defined calibration schedule traceable to UKAS-accredited references, and in-house verification checks run daily on critical instruments. When a customer’s specification pushes against the limits of our standard measurement capability, we work with accredited metrology laboratories to provide the additional traceability the application requires.
If you are specifying a component that requires measurement support beyond standard dimensional checks, our technical glass product range and sector-specific capabilities are a useful starting point for a conversation about what is achievable.

Sources
The following standards and references are the authoritative starting points for traceable glass measurement in the UK and internationally.
- Fringe analysis for thickness estimation of optical glass plate using Fizeau interferometer
- Measurement of glass thickness and refractive index based on spectral interference technology
- Viscosity measurement methods for glass
- Precision measuring tools and gages: a primer (Advanced Manufacturing)